With its focus on user interface, PhysPics has evolved a number of tools for choosing colors.
! http://physpics.com/pictools/colorTable.xlsx,,,,
RGB,NAME,VARIANT,SOURCE,LINK
#B0BF1A,Acid green,,,/wiki/Acid_green
#7CB9E8,Aero,,,/wiki/Aero_(color)
#F0F8FF,Alice blue,,(CSS),/wiki/Alice_blue
#84DE02,Alien armpit,,,/wiki/Sasquatch_Socks
#E52B50,Amaranth,,,/wiki/Amaranth_(color)
#CD2682,Amaranth cerise,,,
#FFBF00,Amber,0,,/wiki/Amber_(color)
#FF7E00,Amber,1,(ECE),/wiki/Amber_(color)
#FF033E,American rose,,,
sample entries in colorlist.csv
Central to all color tools is a list of named colors.
In a fit of psychoneurotic completism
I decided to collect all the named color.
I started with the HTML & CSS colors,
but eventually realized that Wikipedia was way ahead of me.
So I took their lists
(A-F,
G-M,
and N-Z)
and added a few colors I found elsewhere.
The Wikipedia list includes HTML, CSS, the Crayola colors
and several other sources.
The complete spreadsheet where I made the list is at
colorTable.xlsx,
in the worksheet "Combined-Rationalized".
For access by software, the colorlist is copied from that worksheet
into colorlist.csv
(csv is for comma-separated list).
For more on creating that list, see ColorList.php.
color-spec
	color-designator [opacity-designator]
color-designator
	color-name
	number
	#three-hex-digits
	#six-hex-digits
	#(rgb,hsb)(arg,arg,arg)
	#(rgb,hsb)a(arg,arg,arg,arg)
opacity-designator
	* number
an arg is an integer, a float, or integer%
syntax for color specifications in SSColor.java
When an application asks a user for a color, the SSColor class provides a very general parser for color names and values. It recognizes all the names in ColorTable.xlsx. as described above. But it lacks a visual color chooser.
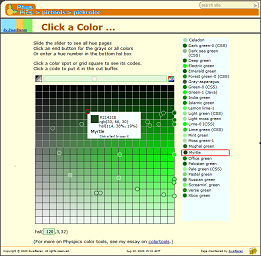
Visual color picker. Screen image at the right. The central grid shows one of the vertical slices of an hsl color-space. Clicking on a color spot chooses it. The user may also click anywhere in the grid and get the coordinates for that color. The slider at the bottom chooses which hue will be shown in the color slice.
When a color is picked, its representations--name, rgb, hsl--are shown in a rectangle. A single click on any of these puts it into the cutbuffer for use elsewhere.
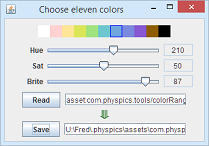
In displaying temperature maps or values scales you may want to distinguish the values with colors. With the ColorRange tool, you adjust the colors of ten blocks to design a set of value colors. To run it, you download and install the toys package, then click the ColorRange icon.
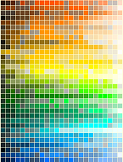
While I was still imagining I could lay out colors in 2-D, I wrote a program to generate various layouts. Mostly the plan was to generate rows in order by hue and arrange each row by some combination of saturation and lightness, as illiustrated to the right. The source is available should you have a few hours to fritter away.