|
How to continuously plot GPS data (Lat/Long) ?
I want to feed the UI with Lat/Long data (from GPS device or file)
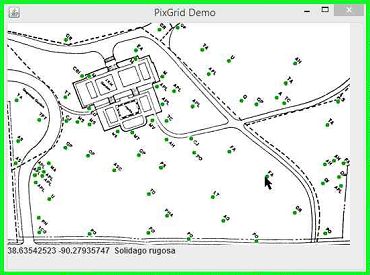
and plot a line/track [as at the right]
Please advice me how solve this
- - Should I plot a x/y graph using the Lat/long as is ?
- - Is there some ready java package/API that I can use ?
Attached are the sources for two classes I've built for dealing with lat/long values.
LatLong.java PixGrid.java
A LatLong object itself merely holds a lat/long value and has methods to convert it to various forms.
The PixGrid object is more interesting;
it maps between lat/long space and a pixel grid suitable for display.
A key feature is PixGrid's tool to map lat/longs to pixels.
To use this tool, I capture an image from GoogleEarth and note down the lat/long values for points on the image.
Then I make a table listing for each point its lat/long value
and its x,y position in the image. From this table,
the tool builds a mapping between pixel space and lat/long space.
The least-squares routines I used are from virtualrisk.cvs.sourceforge.net/viewvc/virtualrisk/util/lma/; it is now moribund, but here's a cached copy.
PixGrid has two parts that would be in separate applications.
The first analyzes a table of points given both map pixel coordinates
and lat-long values. With a least squares fit it computes the parameters for the four equations relating pixel location to lat-long. For instance, the longitude corresponding to x,y is computes by longitude = p1*x + p2*y + p3. The second part of the computation does those calculations. Between the two parts, the parameters are saved with Java's serialization support.
A more robust solution would compute an AffineTransform so image scaling could be readily supported.
For these notes I wrote the demo program below. It first computes the mapping
between earth and screen image.
It then displays a map. As the mouse moves over the image,
a label shows its location and the name of a nearby flower.

(The green border is from Window's "Steps Recorder".
I used it to capture the image with the cursor.)
To play with the demo, download
InstallCheckTools, double click to install it,
double click the CheckTools jar file to run it, and click "PixGridDemo".
|