The New York Times posts "The Upshot", estimating the chance of each candidate winning. It leverages some thirty-seven polls and does some sort of pseudo-scientific evaluation of scenarios. to report headlines like
Hillary Clinton has a 70% chance of winning the presidency.
With cute sports analogy caveats like
Mrs. Clinton's chance of losing is about the same as the probability that an N.F.L. kicker misses a 47-yard field goal.
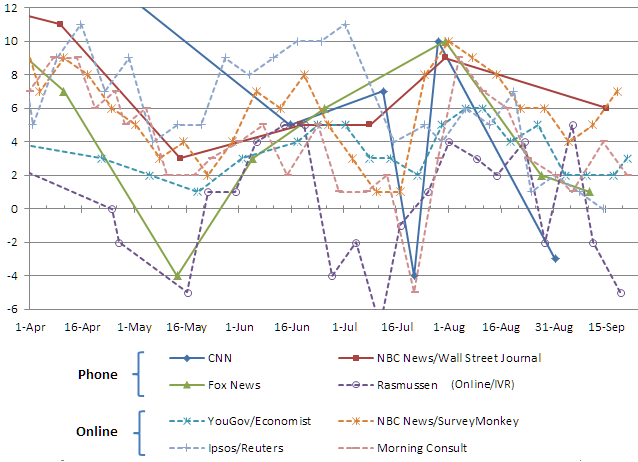
The site shows prominently the changing probabilities over time. I thought it might be interesting to look at the progression of individual polls. Here's what I found, looking only at the polls with nine or more instances.
 The phone polls are solid lines. (Rasmussen combines an online poll and robotic telephone surveys.)
As Clinton was gathering the last of the delegates she needed to win, the telephone polls converged on giving her a 5 point edge. Only CNN reported a poll between the conventions; in it, Trump had taken the lead. A short while later the Democrats completed their convention and Clinton zoomed back to the lead. Rasmussen and Morning Consult showed similar effects. During the convention season, the on-line polls were a bit erratic.
Since the high point of the last convention, Trump has regained some ground. The online surveys have settled into agreement with a 2-3 point lead for Clinton. Curiously, the phone polls diverged.
Which are right, the phones or the online? The only answer to that question is still six weeks away. In the meantime we can expect to discuss the effects of the debates on the polling results..

